by Corbin Blackburn
After a rough year in the stock market like 2022, one of the most frequent questions investors tend to ask themselves is “Should I sell this stock or investment?” I can’t blame them either. Every single person, whether they like to admit it or not, has an emotional tie to their money. They’ve worked hard for it and have big plans for it in the future, so seeing 25%, 50%, or even 75% of that disappear in the matter of a year can cause them to begin to question every money decision they’ve made in the past. So, the real question is, how can you remove as much emotion from the situation as possible and allow yourself to make the right decision moving forward?
To answer that question, I believe you have to go back to why you made the initial investment to begin with. That may differ for everyone, but at Cleveland Wealth we stick to a consistent formula for determining what goes into a portfolio:
- What goals do you have for this money? And what is the timeframe for those goals?
- How does this investment fit into your plan for those goals?
- How much risk can you and your plan tolerate to achieve those goals?
- Which investments can offer the greatest risk return tradeoff, or value to help you hit that risk profile?
If you haven’t gone through those 4 basic steps, I’d recommend starting there before you decide if you’re buying or selling anything. Once those 4 steps are in place, it’s time to determine if this stock that is down 25%+ still offers you the best risk/return tradeoff moving forward. When reviewing this stock, it’s important to remember that you’re investing in a business, not just some ticker symbol that goes up and down on a day-to-day basis. “Price is what you pay. Value is what you get”– Warren Buffett. When Warren said this quote, he was referring to the amount of people who buy and sell stocks simply because of what the price of the stock is doing, instead of looking deeper at the underlying business that the stock tracks.
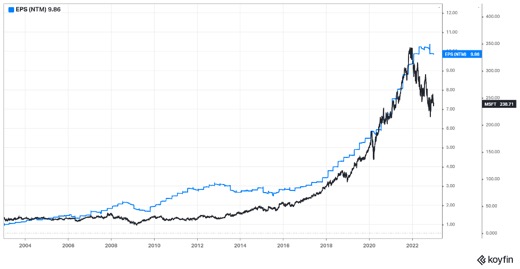
Over the long term, stocks tend to perform relatively in-line with how the underlying business performs. If a business’s revenue and earnings grow, the stock typically does so as well. If the revenue and earnings stall out or go backwards, the stock typically does as well. Take a look at the chart below of Microsoft (MSFT). In this chart, you’ll see that over the last 20 years this stock’s Earnings Per Share (Blue Line) and the stock price (Black Line) tend to move in the same direction. However, during short-term periods the stock will either perform above or below the business performance. The most recent period of that stock underperformance is during this last year. There are certainly a number of legitimate factors that drive this underperformance, but at the end of the day the company performance hasn’t gone backwards.
This alone obviously doesn’t make Microsoft a great buy or hold for everyone, but it’s meant as an example to show that looking under the hood of a falling stock price is important to remove emotion and make sound decisions. By removing emotion, focusing on incorporating high quality businesses, and staying patient you will set yourself up for more efficient investment outcomes over the long-term.
Cleveland Wealth, LLC is a registered investment adviser. Information presented is for educational purposes only and does not intend to make an offer or solicitation for the sale or purchase of any specific securities, investments, or investment strategies. Investments involve risk and unless otherwise stated, are not guaranteed. Be sure to first consult with a qualified financial adviser and tax professional before implementing any strategy discussed herein. Past performance is not indicative of future performance.